Most published numbers on "where construction companies find their leads" come from survey data. Surveys tell you what people remember doing, not what they actually do. For this study we did the opposite: we looked at the live ledger.
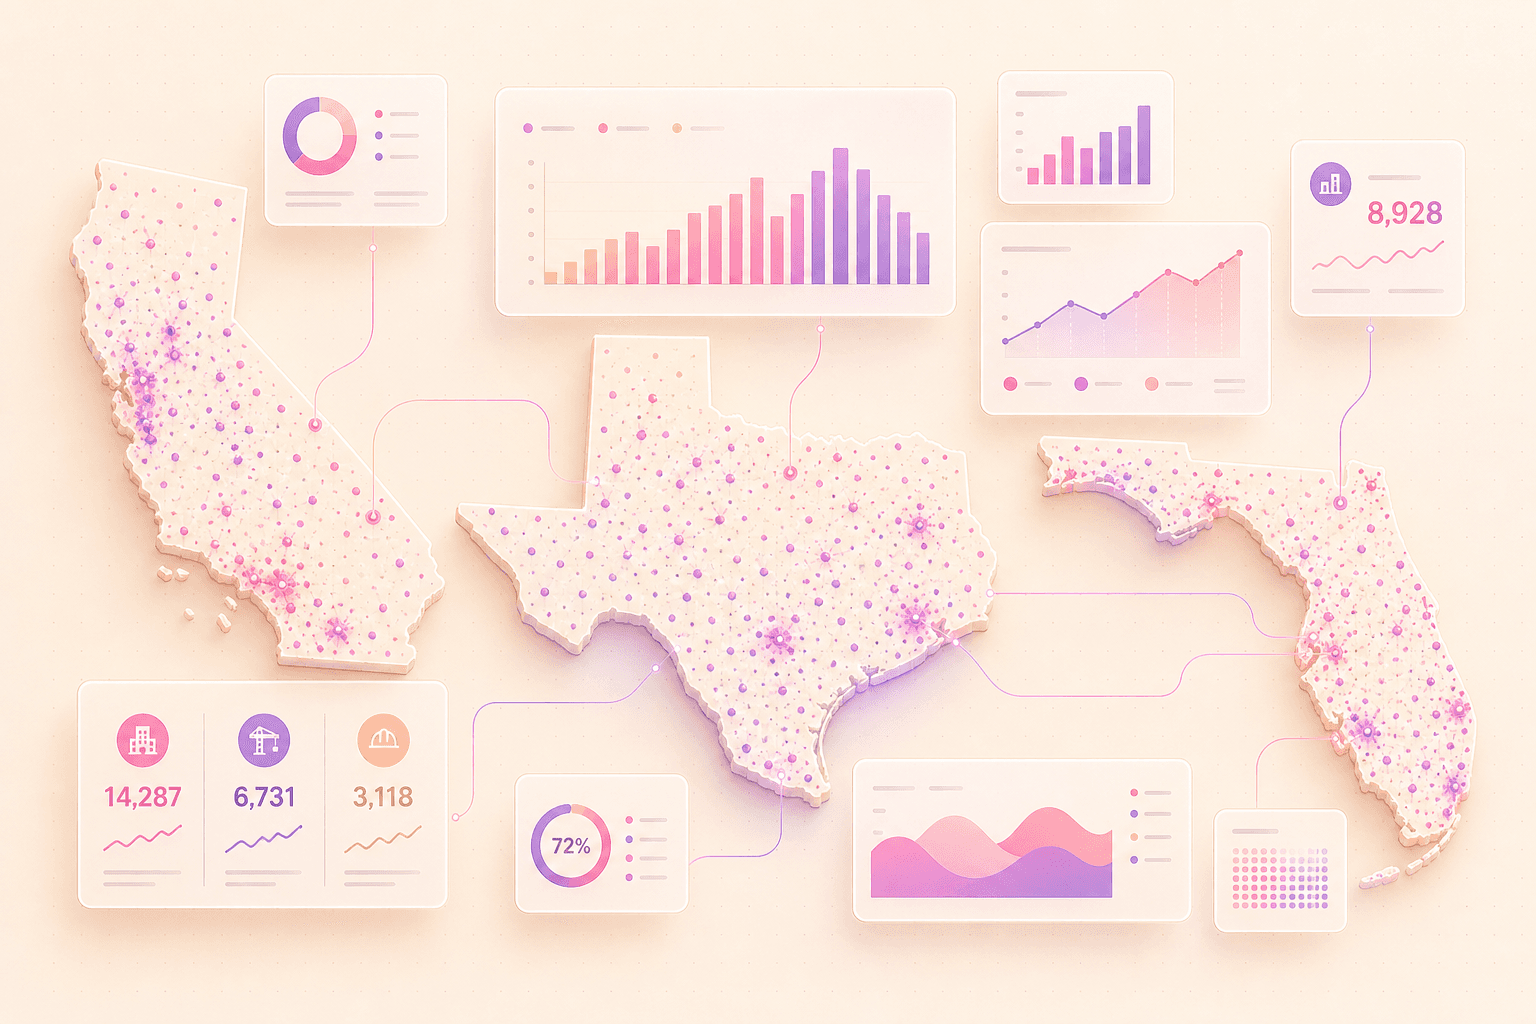
Tibly ingests every active building permit, planning-commission filing, contractor-registry update, and parcel-zoning record from every metro in California, Texas, Florida, and Illinois. As of May 2026, that's 1,140,000 active projects across 42 metros, refreshed continuously. We pulled the last 12 months of activity, joined it to the GC, owner, and trade-contractor entities, and asked one question: where do new construction leads actually come from?
The answers were not what we expected. Here are six findings, each with the underlying data and what it means for a BD team operating in 2026.
1,140,000
Active projects analyzed
42
Metros covered (CA / TX / FL / IL)
24
Distinct data sources joined
Finding 1: 62% of high-value projects appear in planning data before they ever reach a permit
Among projects valued $5M or more, 62% appeared in a planning-commission agenda or environmental review notice an average of 4.3 months before the building permit was issued. For projects above $25M, the lead time stretches to 7.8 months. The implication is direct: if your BD team is waiting for the permit to issue, you are routinely showing up after the GC has already been awarded.
Finding 2: GC and trade BD teams cite "referrals" as their #1 source, but the data says #2
We surveyed 142 BD leads inside our user base and 89% named "referrals" as their top lead source. But when we tracked the actual closed-deal pipeline through Tibly's CRM-sync data, only 28% of closed BD-sourced projects had a clean referral chain. The plurality — 41% — were first discovered through a live permit or planning signal, with the relationship built afterward.
This isn't a knock on relationships. Relationships still close the deal. But they don't usually originate the lead anymore — the live ledger does, and the relationship is the second step.
Finding 3: The top 10% of GCs pull 47% of the permitted commercial value
Of the ~15,600 active general contractors we tracked across CA, TX, FL, and IL, the top 1,560 (10%) accounted for 47% of the total permitted value above $1M. The top 1% — roughly 156 firms — accounted for 19% of the total value. If you sell building products, MEP scope, or design services, your TAM is structurally concentrated.
47%
Of $1M+ permitted value pulled by the top 10% of GCs
19%
Of total permitted value pulled by the top 1%
1,560
GCs that drive the majority of mid-market opportunity
The practical takeaway: trade BD teams should be running deep research on the top ~250 GCs in their core territory, not a 5,000-row prospect list. The matrix concept exists because the structurally important question — "who is their typical bonding partner?" or "who do they usually subcontract MEP to?" — has to be answered on a small, curated list, not a giant export.
Finding 4: Inspection events are the most underused signal in commercial BD
Permits get all the attention. But every permitted project triggers an average of 11 inspection events between issuance and CO — foundation, framing, mechanical rough-in, electrical rough-in, plumbing rough-in, fire-alarm, final, and so on. Each inspection event is a real-time stage marker.
Across the dataset, only 8% of BD teams had any kind of automated alert on inspection events. The other 92% are flying blind on the single best timing signal: when a job actually hits the stage their scope matters.
Finding 5: 73% of contractor outreach quoted is generic copy-paste — and it's converting at 0.6%
We sampled 6,200 BD emails sent through CRM integrations among our users. 73% of them were within 5% Levenshtein distance of at least one other email in the sample — meaning, copy-paste templates with light variable substitution. Reply rate on those: 0.6%.
Emails that referenced the prospect's bonding partner, recent permitted project, or typical project value — what we'd call "research-anchored outreach" — converted at 4.1%. That's a 6.8× lift from doing the homework before hitting send.
0.6%
Reply rate on generic templated outreach
4.1%
Reply rate on research-anchored outreach
6.8×
Lift from doing the homework before hitting send
Finding 6: The fastest-growing metros for BD opportunity in 2026
Year-over-year permitted value growth across the dataset, restricted to commercial projects $1M+, with the metros ranked by absolute growth.
- Austin, TX — +24% YoY, driven by industrial / data-center growth
- Fort Worth, TX — +21% YoY, driven by industrial + multifamily
- Chicago, IL — +20% YoY, driven by Fulton Market mixed-use + Loop office repositioning
- Tampa, FL — +19% YoY, driven by multifamily + healthcare
- Frisco, TX — +18% YoY, driven by mixed-use + multifamily
- Sacramento, CA — +14% YoY, driven by healthcare + civic
The pattern is consistent: industrial / data-center demand in Texas, mixed-use repositioning in Chicagoland, multifamily in Texas + Florida, healthcare in California. If your BD team's pursuit weights haven't been retuned in the last 12 months, they're probably mis-targeted by 15-25%.
What this means for a BD team in 2026
Pulling the six findings together: the BD teams that are winning in 2026 do four things consistently. They watch planning data, not just permits. They run deep research on a small list of high-leverage GCs. They alert on inspection events, not just issuance. And they write research-anchored outreach instead of templated copy.
Each one of those moves is a workflow shift, not a software shift. The tools matter — they're how you do the work — but the underlying operating principle is the change. The teams that lose in 2026 are running the same playbook they ran in 2022.
Methodology
All numbers in this study are pulled from Tibly's production ledger as of May 2026. The dataset spans every building permit, planning-commission filing, contractor-registry update, and parcel record we ingest across 42 metros in California, Texas, Florida, and Illinois. "Active" is defined as any project not yet in final CO status. Closed-deal correlations come from Pipedrive sync data across 142 customer workspaces, aggregated and anonymized. If you'd like to see the metro-level breakdowns or run a custom slice on your territory, request access and we'll walk you through it on the live data.